AI tooling for SREs
· 9 min read
If you have been on call for a nasty production incident and tried to figure out what’s happening, jumping from console to console and checking logs across multiple systems, you have felt the pain of a real site reliability engineer. I am coming from an SRE background, so I have definitely been there.
AI and agents have gone mainstream for code generation, but they are trending up in the SRE tooling category as well. Let’s take a look at how this space is evolving as almost every observability vendor and cloud provider now ships an agent that investigates alerts on its own.
Where AI fits in the SRE workflow
Detect and triage: This is the oldest and most proven use of machine learning in operations. Tools group related alerts and manage noise. Event correlation platforms such as BigPanda and ServiceNow have done this for years.
Investigate: The agent forms hypotheses about the cause. It queries metrics, logs, traces, and recent changes, then shares findings. The promise here is to reduce incident investigation time for operators as much as possible.
Remediate: The next step is to attempt to fix the issue. The spectrum here varies from suggestions to opening pull requests, running a runbook, restarting services, or performing actions on a platform. In reality, most teams aren’t yet comfortable letting agents auto-operate and auto-remediate production systems.
Learn and prevent: After the incident, AI drafts the postmortem timeline and links the incident to similar past ones.
How an AI SRE agent works
Most agents run a similar loop: alerts fire, agents pull context and form hypotheses. They collect more data and evidence and possibly run investigation commands to finalize which hypothesis to accept.
Two things decide the quality of that loop: the context the agent can see, and the tools it has available.
Context means telemetry, service topology, deploy and config history, runbooks, ownership data and past incidents. Most agents now reach tools through the Model Context Protocol (MCP).
To improve accuracy of these agents, some vendors pair language models with deterministic analysis. We see more and more topology graphs and causal engines being part of these solutions.
Agents can also pass work to each other. Observability-focused agents can be used to send information to remediation-focused agents that open PRs or perform hot-fixes, while incident management agents update live cases with everything that happens.
AI SRE tools in 2026
Agents inside observability platforms
Datadog Bits AI SRE: It starts an investigation when a monitor fires and tests hypotheses against telemetry and runbooks. The conclusion is posted to Slack or your incident tool.
Grafana Assistant Investigations: Grafana Labs moved Investigations to general availability in July 2026, together with its Cloud MCP server and an agentic CLI called gcx. The agent forms hypotheses and checks them against your Grafana data. Engineers can steer it mid-run, or wait for the report at the end. It suits teams already on the Grafana LGTM stack (Loki, Grafana, Tempo, Mimir).
Dynatrace Intelligence: It pairs the existing causal engine (formerly Davis AI) with agents that act inside set guardrails.
Checkly Rocky AI: Rocky’s starting point is a failing synthetic check, such as a Playwright browser flow, an API call, a DNS lookup, or a TCP check. Each analysis has four parts: a classification (an infrastructure error or a downstream dependency, for example), the root cause, the user impact, and a suggested fix.
Cloud provider agents
AWS DevOps Agent: When an alarm fires, the agent starts investigating, using a topology it builds from telemetry and code. Afterward, it recommends changes. Integrations include CloudWatch, Datadog, Dynatrace, Grafana, PagerDuty, GitHub, and ServiceNow.
Azure SRE Agent: It reads Azure Monitor data, including Application Insights and Log Analytics. It also connects to GitHub, Azure DevOps, Jira, and Slack.
Gemini Cloud Assist Investigations: Google’s root cause agent analyses Cloud Logging data and configuration changes from Cloud Asset Inventory. It ranks its observations and suggests fixes. Its knowledge base includes Google SRE playbooks and Cloud support material.
Incident management platforms
PagerDuty SRE Agent: It joins the on-call roster and escalation policy as a virtual responder. It runs diagnostics before a human gets paged. PagerDuty plans a fully autonomous responder soon.
incident.io Investigations: incident.io’s agent works inside Slack. It links alerts and code changes to past incidents. It also pulls data from Grafana and Datadog, then drafts the postmortem. When the cause sits in code, an engineer can ask it to write a fix and open a pull request from the incident channel.
Rootly: Rootly adds AI to a Slack-first incident workflow. It links incidents to recent code changes, and it writes a catch-up summary for responders who join late.
These platforms own the process. The telemetry lives elsewhere and is accessed through integrations, so their investigations go only as deep as the available connections.
Standalone AI SRE agents
Resolve AI: One of the most prominent standalone players. It provides agents that triage, mitigate, and remediate issues, either (semi-)autonomously or alongside humans.
Traversal: Traversal builds a model of the production environment and runs a causal search across it. The search can follow a failure through many service hops. Focused on large enterprises with complex service graphs.
Cleric: Cleric checks changes in production and investigates regressions, producing fix PRs with the evidence to review them.
Komodor Klaudia: Komodor focuses on Kubernetes; Klaudia is its multi-agent system tuned for Kubernetes failure modes.
Open source and build-your-own
HolmesGPT: Robusta created HolmesGPT, now a CNCF Sandbox project. It breaks a question into tasks, queries Prometheus, Kubernetes events, logs, and runbooks, then returns a diagnosis.
K8sGPT: Also a CNCF Sandbox project. It runs analyzers across a cluster and explains Kubernetes errors in plain language. It supports local model backends and can anonymise data before anything reaches a model.
kubectl-ai: Google’s open source assistant turns natural language into kubectl commands. It can also run as an MCP server, so other agents can call it.
MCP servers plus a general agent: Many teams now point a general-purpose coding agent (such as Claude Code or Codex) at MCP servers for Grafana, Kubernetes, GitHub and their cloud provider, then add a short runbook prompt. This gives you control over the on-call investigation, and it offers a familiar interface for engineers.
Open source also gives you control over the model and over where your data goes.
Trust, permissions and guardrails
Most SREs will still agree in 2026 that they wouldn’t be 100% confident to let an AI agent change production. Reversible actions like scaling capacity are probably ok, but things get scary on anything that touches data. Gartner 2026 research on infrastructure operations forecasts that human-in-the-loop in IT operations workflows will fall from 95% in 2025 to 40% by 2028.
Autonomy usually grows in four levels:
Read-only investigation: The agent queries data and reports back, but can’t change anything.
Suggest and draft: The agent proposes a fix as a pull request or a runbook step.
Act with approval: The agent runs actions from an approved list after a human confirms.
Bounded autonomy: The agent acts alone on a short list of reversible actions, such as scaling out, restarting a pod, rolling back a deploy, or turning off a feature flag. Automatic rollback kicks in if health checks fail.
Keep these controls in place across solutions:
- Give every agent its own identity with least-privilege IAM.
- Log every query and action.
- Put approval gates on business-critical changes.
Platform readiness for AI agents
An agent can only reason over what your platform exposes.
Ownership and documentation: Every service has a defined owner, a README, and runbooks the agent can read. Many teams now add an AGENTS.md file to each repository, with context written for agents: how the service runs, where its logs live, which dashboards matter.
Telemetry and topology: Structured logs, metrics with consistent labels, and OpenTelemetry traces that cross service boundaries. A service catalog or dependency map gives the agent the relationships it needs to follow a failure from symptom to cause.
Change and rollback: Deploy markers on dashboards, configuration changes tracked in Git, feature flags, and an automated rollback path.
Signal quality: Alerts tied to SLOs, each one linked to a runbook.
How to measure success
Here are a few high-level categories of metrics to track:
Utilization: How much the team relies on the agent, and how often on-call engineers act on its findings. Measure how many postmortem drafts, user questions, and fix PRs you get on the tool.
Accuracy: How often the agent is right. Track root cause precision (the top-ranked cause, confirmed in the postmortem) and false leads per investigation. Add the share of investigations that end inconclusive, and the share of suggested fixes merged without changes. Review these often; precision drifts as your systems change.
Impact: Track time to first useful hypothesis, MTTR, escalations per incident, and active incident hours per on-call shift. Ask on-call engineers every quarter how they feel about using the tool.
Cost: Track total agent spend and cost per investigation, then set both against engineer hours saved.
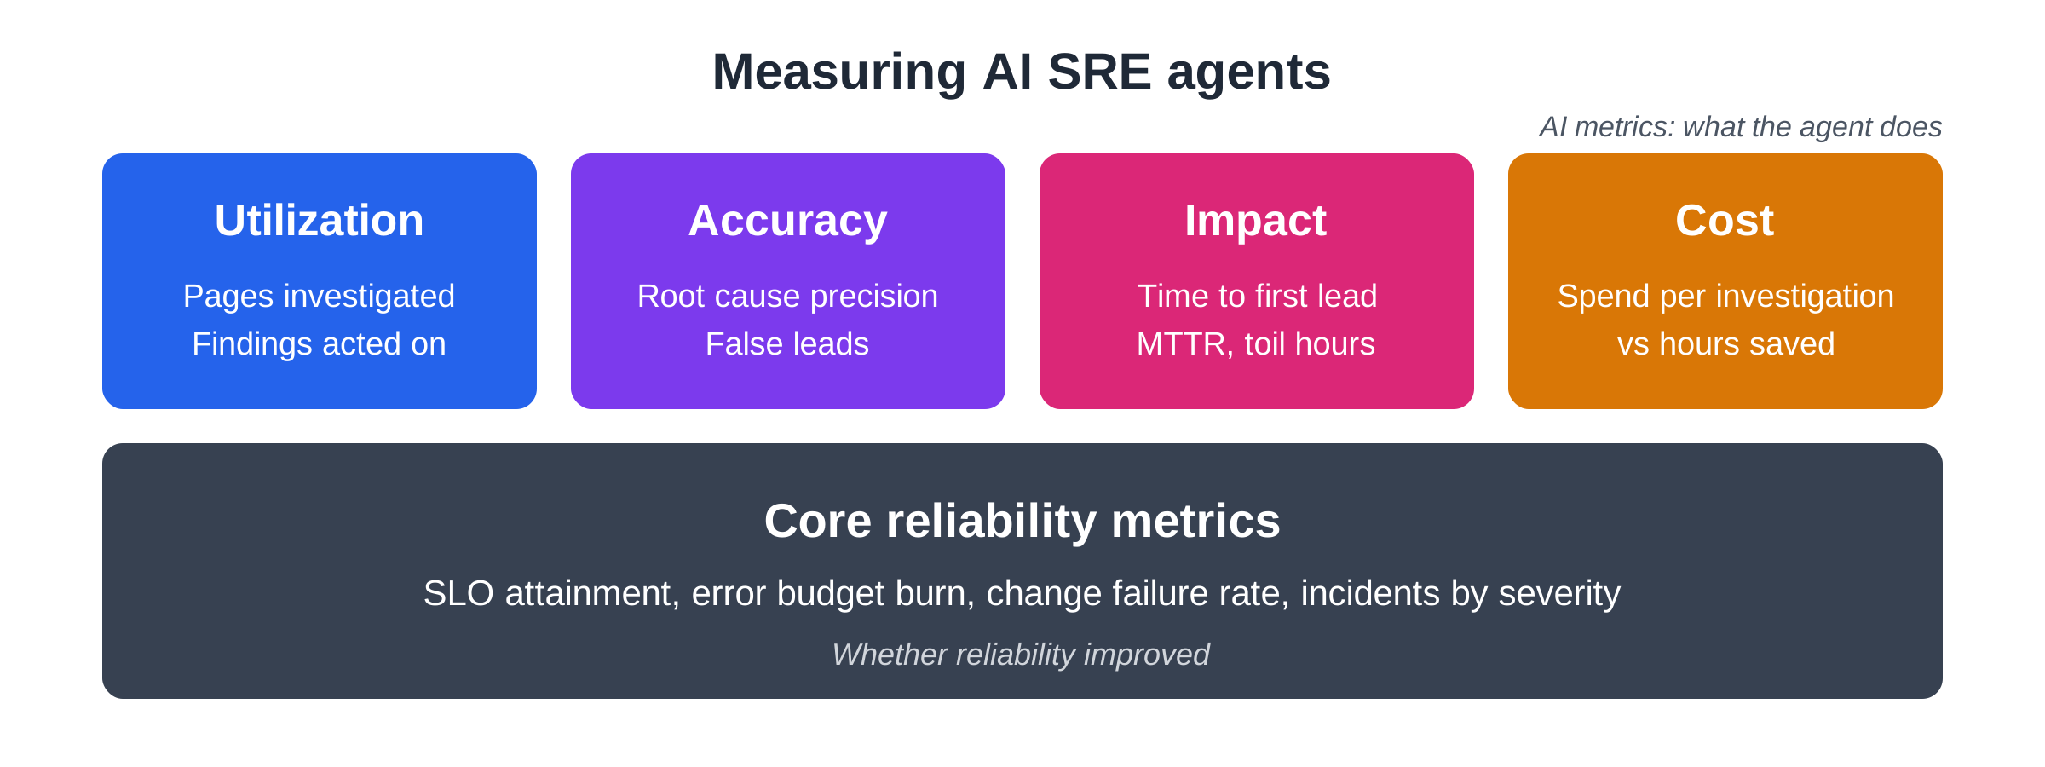
AI metrics on top of core reliability metrics
Keep your core reliability metrics underneath all four. AI metrics describe what the agent does. SLO attainment, error budget burn, change failure rate and incident count by severity tell you whether reliability improved. Take a baseline before rollout and keep both sets on the same dashboard.
Frequently asked questions
What does an AI SRE agent do?
It investigates alerts on its own. When an alert fires, the agent pulls context, forms hypotheses about the cause, queries metrics, logs, traces and recent changes, then shares its findings. Some agents go further and suggest fixes, open pull requests or run runbook steps.
How do AI SRE agents connect to my tools?
Most agents now reach tools through the Model Context Protocol (MCP). The quality of an investigation depends on the context the agent can see (telemetry, topology, deploy history, runbooks, ownership, past incidents) and the tools it can call.
Which category of AI SRE tool should I look at?
Start from where your data lives. Observability platform agents work directly on that vendor’s telemetry, such as Grafana Assistant on the LGTM stack. Incident management platforms own the process, but their investigations only go as deep as their integrations. Open source tools and MCP servers with a general agent give you control over the model and over where your data goes.
Should I let an AI agent fix production on its own?
Most teams are not there yet. Grow autonomy in levels: read-only investigation, then suggest and draft, then act with approval, then bounded autonomy on a short list of reversible actions such as scaling out or rolling back a deploy. Keep approval gates on business-critical changes and anything that touches data.
What does my platform need before I add an AI SRE agent?
Defined owners, READMEs and runbooks for every service (many teams add an AGENTS.md file per repository). Structured logs, consistently labelled metrics and OpenTelemetry traces, plus a service catalog or dependency map. Deploy markers, config changes tracked in Git and an automated rollback path. Alerts tied to SLOs, each linked to a runbook.
How do I measure whether an AI SRE agent is working?
Track four categories: utilization, accuracy, impact and cost. Keep core reliability metrics such as SLO attainment, error budget burn, change failure rate and incidents by severity underneath them. Take a baseline before rollout and keep both sets on the same dashboard.